Stochastic Oscillator
Introduction
Stochastic- it is an oscillator developed by George C. Lane in the late 1950s, It is a momentum indicator which is comparing the closing price of a security to the range of its prices over a certain period of time. Seeing nature through the lens of probability theory is what mathematicians call the stochastic view.The word comes from the Greek stochastes, a diviner. It in turn comes from stokhos, a pointed stake used as a target by archers.
The Stochastic indicator is designed to display the location of the close compared to the high/low range over a user defined number of periods. Typically, the Stochastic Oscillator is used for three things; Identifying overbought and oversold levels, spotting divergences and also identifying bull and bear set ups
or signals.
The Stochastic Oscillator indicator, is a classic tool for identifying changes in momentum. It is a versatile indicator that can be used over a wide variety of timeframes (days, weeks, months, intraday) which adds to its popularity. When it comes to generating signals, the Stochastic Oscillator can indeed produce quality signals. Keep in mind though, that when using it as a signal generator (especially for divergences and bull/bear setups) it is best when used going with the trend. The technical analyst should be aware of the overall trend of the
market. It would not be unwise to use Stochastic along with other means of technical analysis such as trend lines to confirm the market direction.
Want to trade in Stochastic ? Visit our website Click here
Calculation
Stochastics can be calculated on the basis of two lines; %K and %D.
'''%K is the percentage of the price at closing (K) within the price range of the number of bars used in the look-back period.'''
%K = SMA [100 * (Current Close - Lowest Low) / (Highest High - Lowest Low), smoothK]
'''%D is a smoothed average of %K, to minimize whipsaws while remaining in the larger trend.'''
%D = SMA (%K, periodD)
Lowest Low = The lowest price within the number of recent bars in the look-back period (periodK input)
Highest High = The highest price within the number of recent bars in the look-back period (periodK input)
Take a Look at the Chart shown below:-

In the above Chart shown You can see the % D Line in yellow Colour and % K Line in green.
Lines %K and %D obtained using the above defined formula are called fast lines (%K fast, %D fast). %K slow is obtained by calculating SMA of %K fast, while formula for %D fast remains the same except it is applied on %K slow.
Lines %K and %D obtained using the above defined formula are called fast lines (%K fast, %D fast). %K slow is obtained by calculating SMA of %K fast, while formula for %D fast remains the same except it is applied on %K slow.
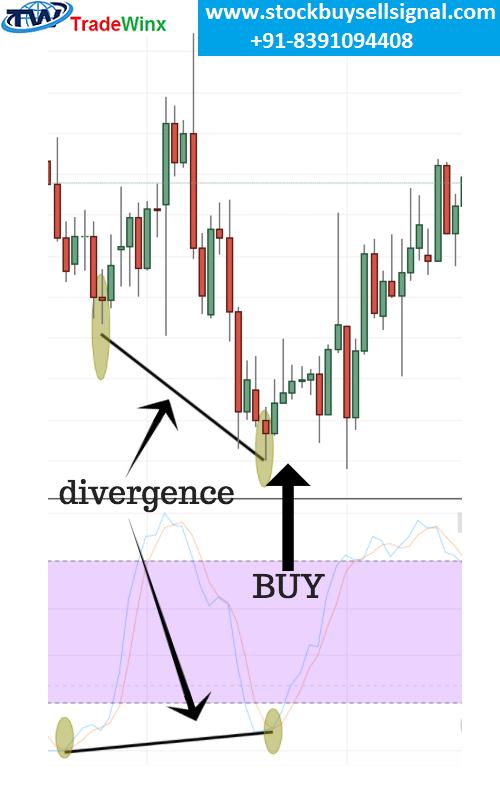
Positive Divergence
Market participants are looking for a positive divergence when they are looking to buy. The divergence principles with Stochastic are the same as in any other oscillator’s divergence. We are looking for an extreme low level in the oscillator. The price should be making a new low, while the oscillator should be forming a higher low than the previous one. Have a look at the Chart shown in left side.

Negative Divergence
Stochastic is giving a signal to sell when there is a negative divergence between price and the indicator. Traders are looking for an extreme reading in the indicator. There needs to be a higher high in the price chart corresponding to a lower second high on the indicator. Once this scenario is present, traders are selling by rule that is shown in this chart.
Conclusion
As with any other indicator or trading method, using Stochastic is not a holy-grail of trading. If you are using this indicator, you should consider using it in combination with other tools. This article’s aim was to show you technical analysis from another angle. Using many indicators and messing up your charts is definitely not the solution- at least not for ours. For the eager ones amongst you, this article should have hopefully revealed another side of trading in Stochastic. You should not forget that when trading, you should be trusting in your abilities and belief more than anything else. Discipline is extremely important and money management and risk management should not be underestimated! You should be very risk averse, since capital is your only asset !
Follow your dreams and if you have any questions relating to this just go to our website